
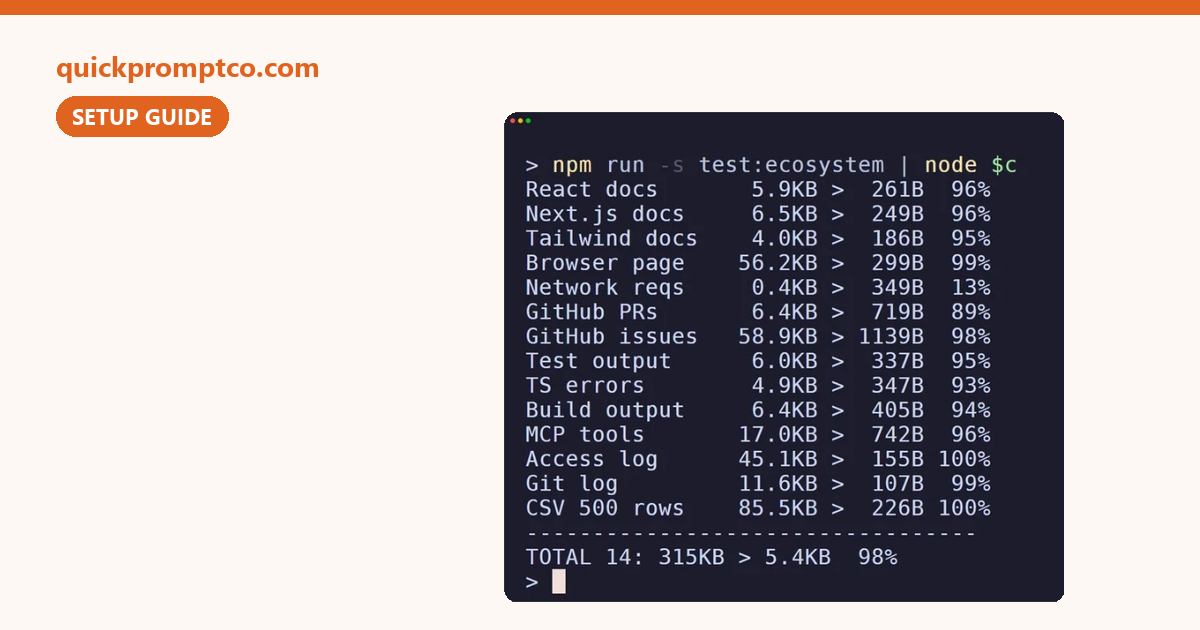
Last Verified: October 22, 2026 — we ran context-mode’s own benchmarks and two of our real logs on Windows 11, Node 24.18.1, context-mode v1.0.169 (commit a92cf6a). Local scripts only, no Claude session
When Claude Code runs a tool, the whole output lands in its context window: a 56 KB page snapshot, a 100 KB build log, every line of it. context-mode changes where that output goes. The raw output stays in a sandbox on your machine, a small script reads it there, and only what that script prints reaches Claude. It isn’t compression. Nothing gets squeezed; most of it simply never enters the conversation.
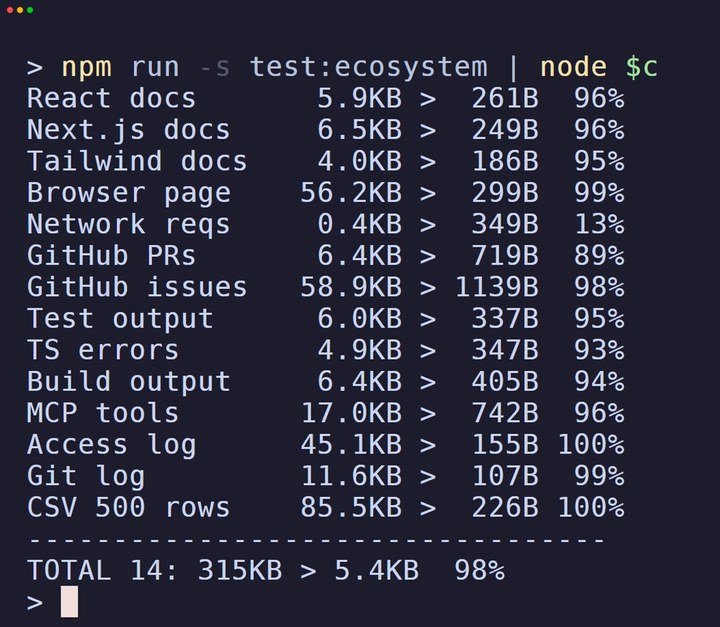
The README says 315 KB becomes 5.4 KB, 98% less. We wanted to know if that holds, what it actually counts, and what happens on our own logs. So we cloned the repo, ran its benchmarks, and pushed two of our own files through the same sandbox. Here’s what came out.

Measured by us · October 22, 2026
Windows 11 laptop, Node 24.18.1, context-mode v1.0.169 (commit a92cf6a), installed from GitHub with npm install --ignore-scripts. No Claude login, no API key: we ran the repo’s benchmark scripts and its real sandbox executor locally.
| What we ran | Result |
|---|---|
| The README benchmark, 14 scenarios | 315 KB → 5.4 KB in context, 98% less. 13 of 14 rows matched BENCHMARK.md to the byte |
| All 21 benchmark scenarios | 95.8% (the docs say 96%) |
| Same 14, counting the summary scripts too | about 95% (94.7%). The benchmark doesn’t count them |
| Our failed render log, 1,117 lines | 103 KB → 329 B. The error message was still there, word for word |
| A small 0.4 KB network log | 13%. Small outputs barely gain |
Sizes are bytes of text that would enter the context. The repo turns bytes into tokens by dividing by 4; we didn’t run a real tokenizer, and we didn’t measure tokens, cost or session length inside Claude Code.
Quick Start
- What it is: an MCP server plus a Claude Code plugin. It adds sandbox tools (run code on a file or command output, index and search docs) and hooks that nudge Claude to use them instead of dumping raw output.
- Who made it: Mert Koseoglu (GitHub
mksglu). Not made by Anthropic. - Cost: free to use. License: Elastic License 2.0, which is source-available, not an OSI license (details below). About 31,700 GitHub stars (October 22, 2026).
- Works best on: big, noisy output: logs, page snapshots, issue lists, CSVs. Not on output that’s already small.
Install, in Claude Code (two lines from the README):
/plugin marketplace add mksglu/context-mode
/plugin install context-mode@context-modeOn this page (12 sections)
It Doesn’t Compress. Here’s What Happens Instead
Without context-mode, Claude reads a log by pulling the whole file into the conversation. With it, Claude writes a few lines of code (count the errors, keep the failing line, print the stage times) and runs that code in a separate process. The file is read inside that process. Only the console.log output comes back.
| Normal tool call | With context-mode | |
|---|---|---|
| What runs | Read the file / run the command | A short script that reads it, in a sandbox subprocess |
| What enters context | Everything it returned | Only what the script prints |
| Who decides what to keep | Nobody: you get it all | The script, which Claude writes |
| Raw data | In the conversation | Stays on your disk |
The third row matters most: the saving depends on the script. The README’s benchmark uses summary scripts a person wrote in advance. In real use, Claude has to write them, and a careless one could drop the line you needed. That’s why we tried it on a log where we knew what had to survive.
Our Own Log: 103 KB In, 329 Bytes Out
We picked a real failure: the log from a video render that crashed at the very end (1,117 lines, 103,272 bytes). We fed it to context-mode’s actual sandbox executor (ctx_execute_file) with a short summary script, the kind Claude would write: did it fail, how many warnings, the error line, time per stage.
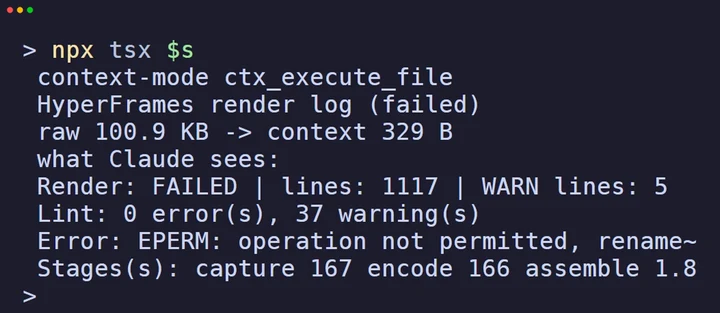
Those 329 bytes held everything we needed to fix it: the render failed, lint found 0 errors and 37 warnings, the full EPERM: operation not permitted, rename error with both file paths, and the stage times (capture 167 s, encode 166 s). That’s 99.7% smaller, or 99.0% if you count the 715-byte script.
We also ran a 158-commit git log --stat (171,711 bytes) through it: 461 bytes came back with the commit count, lines added and removed, the five most-touched files and the last three commits.
Compared with what we actually do today
Nobody pastes a 100 KB log in full. Our habit is tail -20, which on this log is 3,848 bytes. Against that, context-mode’s 329 bytes is about 91% smaller, not 99.7%. On the git log, head -60 was 2,689 bytes against 461 (about 83%).
The bigger difference is what you get: tail shows the last lines, while the script counted all 37 warnings and summed every commit. A tail can’t do that.
All 14 Scenarios, With the Part the Benchmark Skips
This is the README’s main benchmark (BENCHMARK.md, Part 1), run on our machine with npm run -s test:ecosystem. The last two columns are ours: the size of the summary script for each row, and the saving if you count that script as context too (because in real use, Claude has to write it into the conversation).
| Scenario | Source | Raw | In context | Saved | Script size | Saved, script counted |
|---|---|---|---|---|---|---|
| React useEffect docs | Context7 | 5.9 KB | 261 B | 96% | 1,012 B | 79% |
| Next.js App Router docs | Context7 | 6.5 KB | 249 B | 96% | 1,131 B | 79% |
| Tailwind CSS docs | Context7 | 4.0 KB | 186 B | 95% | 916 B | 73% |
| Page snapshot (Hacker News) | Playwright | 56.2 KB | 299 B | 99% | 1,132 B | 98% |
| Network requests | Playwright | 0.4 KB | 349 B | 13% | 1,115 B | bigger than the raw |
| PR list (Next.js) | GitHub | 6.4 KB | 719 B | 89% | 767 B | 77% |
| Issues (React) | GitHub | 58.9 KB | 1,139 B | 98% | 849 B | 97% |
| Test output (30 suites) | vitest | 6.0 KB | 337 B | 95% | 810 B | 81% |
| TypeScript errors (50) | tsc | 4.9 KB | 347 B | 93% | 772 B | 78% |
| Build output | next build | 6.4 KB | 405 B | 94% | 597 B | 85% |
| MCP tools (40) | tools/list | 17.0 KB | 742 B | 96% | 843 B | 91% |
| Access log (500 requests) | nginx | 45.1 KB | 155 B | 99.7% | 704 B | 98% |
| Git log (150+ commits) | git | 11.6 KB | 107 B | 99% | 421 B | 96% |
| Analytics CSV (500 rows) | CSV | 85.5 KB | 226 B | 99.7% | 545 B | 99% |
| Total, 14 scenarios | 315 KB | 5.4 KB | 98% | 11,614 B | 94.7% |
Our run matched BENCHMARK.md on 13 of 14 rows to the byte; the CSV row printed 226 B instead of 222 B. Script sizes include indentation, so they’re slightly generous. The capture above rounds to whole percents, so 99.7% shows as 100%.
Two things stand out. The big wins are on big, repetitive output (a 56 KB page snapshot, a 500-line access log, a 500-row CSV), where even counting the script you keep 97 to 99%. And on small output it doesn’t pay: the 0.4 KB network log only shrank 13%, and once you add the script it’s bigger than just reading the raw output.
Search Mode Is a Different Number
context-mode can also index docs into a local SQLite full-text index and return only the matching sections. The repo benchmarks that separately (Part 2: three fixed queries per document). Our run with npx tsx tests/live-benchmark.ts:
| Document | Raw | Search results | Saved |
|---|---|---|---|
| Supabase Edge Functions | 3,988 B | 2,246 B | 44% |
| React useEffect docs | 6,075 B | 1,494 B | 75% |
| Next.js App Router docs | 6,658 B | 3,311 B | 50% |
| Tailwind CSS docs | 4,102 B | 620 B | 85% |
| Skill prompt (main) | 16,683 B | 0 B | no match (all 3 queries found nothing) |
| Skill references (4 files) | 36,090 B | 2,412 B | 93% |
| MCP tools/list (40) | 2,509 B | 1,016 B | 60% |
Total: 76,105 B → 11,099 B, 85%. Add the 14 Part 1 scenarios and you get the README’s “21 scenarios”: 398,524 B → 16,620 B, 95.8%.
One row isn’t a saving, it’s a miss
The skill prompt file has grown since BENCHMARK.md was written (4.4 KB then, 16.3 KB now), and none of its three fixed queries matched anything in the current version. The script prints 0 bytes and reports it as a 0% row. In real use that would mean Claude gets nothing back and has to search again. Search saves less than the script mode (44 to 93%) and depends on asking the right question.
What We Did Not Test
We measured the sandbox, not a working session. These README claims need a logged-in Claude session, and we haven’t checked them:
- How well Claude writes the summary scripts on its own, how long they get, and how often it has to retry.
- Real token counts. Every size here is bytes; the repo’s tokens are bytes divided by 4.
- Your bill or usage limit. Context bytes aren’t the same as cost; output tokens are a separate thing.
- Longer sessions. The README says sessions last much longer before context fills up. Not measured.
- Picking up after compaction, which the plugin tracks in a local SQLite database.
If you install it, the plugin’s own /context-mode:ctx-stats shows the savings for your session. That’s the number to trust for your work.
Step 1. Install
Claude Code plugin (recommended in the README)
~2 min
Needs Claude Code v1.0.33 or newer (claude --version). Type these where you talk to Claude:
/plugin marketplace add mksglu/context-mode
/plugin install context-mode@context-modeRestart Claude Code (or run /reload-plugins), then check it:
/context-mode:ctx-doctorEvery check should show [x]. Per the README, the plugin registers six hooks and 11 MCP tools, and injects its routing instructions at session start without writing files into your project.
Or: MCP server only (try it without the hooks)
~1 min
From your terminal. You get the tools, but Claude isn’t nudged to use them:
claude mcp add context-mode -- npx -y context-modeCloning the repo to run the benchmarks yourself?
Use npm install --ignore-scripts. The package’s postinstall script contains code that updates Claude Code’s plugin registry; skipping it keeps a benchmark-only clone from touching ~/.claude. We checked: our settings file was byte-identical before and after.
Step 2. Use It
| Command | What it does (per the README) |
|---|---|
/context-mode:ctx-stats | Savings for this session, per tool |
/context-mode:ctx-doctor | Checks runtimes, hooks, the search index and versions |
/context-mode:ctx-index · ctx-search | Index a file or folder, then search it |
/context-mode:ctx-purge | Deletes everything in the local index |
/context-mode:ctx-upgrade | Pulls the latest version and re-wires the hooks |
Day to day you don’t call the tools yourself. Ask Claude to look at a big log or a page and, with the hooks on, it should reach for the sandbox instead of reading the raw output. Then run ctx-stats to see what it actually saved.
How to Remove It
From your terminal (commands checked against claude plugin --help, Claude Code 2.1.308):
claude plugin uninstall context-mode@context-mode
claude plugin marketplace remove context-modeInstalled the MCP-only version instead? claude mcp remove context-mode. If you added the optional status line, delete the statusLine block from ~/.claude/settings.json. Indexed content lives in ~/.context-mode/content/ (per the README); run ctx-purge before uninstalling, or delete that folder.
License and Privacy
context-mode is under the Elastic License 2.0. It’s free to use, copy, modify and share. The main limit: you can’t offer it to others as a hosted or managed service. That makes it source-available; it isn’t an OSI-approved license like MIT.
The README says: “No telemetry, no cloud sync, no usage tracking, no account required.” The one online piece is optional: ctx-insight opens a hosted team dashboard in your browser. We didn’t check its pricing or what it needs.
Reproduce Our Numbers
No Claude account needed. Node 22.5+ (we used 24.18.1):
git clone --depth 1 https://github.com/mksglu/context-mode
cd context-mode
npm install --ignore-scripts
npm run -s test:ecosystem
npx tsx tests/live-benchmark.tsThe first prints the 14 scenarios, the second the 7 search scenarios. Our own-log test used the repo’s PolyglotExecutor.executeFile with a 715-byte summary script; the render log is ours, so your files will give different numbers.
FAQ
Does context-mode cut my Claude bill by 98%?
We can’t say that, and the 98% doesn’t mean it. It’s 98% fewer bytes of tool output entering the context, on the benchmark’s own files with pre-written scripts. We didn’t measure tokens or cost. Check ctx-stats on your own sessions.
Is it compression?
No. The raw output stays in a sandbox process, and only what a short script prints comes back. Nothing is encoded or squeezed.
Will Claude miss important lines?
It can, if the script it writes keeps the wrong things. On our failed render log, the full error line survived in 329 bytes. That’s one log, not a guarantee.
When does it not help?
Small output. Our 0.4 KB network log shrank 13%, and counting the script it got bigger. Search mode saves less too (44 to 93%) and can come back empty.
What license is it under?
It’s source-available under the Elastic License 2.0: free to use and modify, but you can’t resell it as a hosted service.
Sources
- mksglu/context-mode README (install, tools, slash commands, privacy), commit a92cf6a
- context-mode BENCHMARK.md (the 14 + 7 scenarios we re-ran)
- context-mode LICENSE (Elastic License 2.0)
- Our measurements: run on October 22, 2026 on our own machine, raw output kept on file
context-mode by Mert Koseoglu, Elastic License 2.0: github.com/mksglu/context-mode.